Automotive Research

ARC examines link between driving speeds & fuel economy

Speeding traffic on a highwau

Vehicles with traditional internal combustion engines (i.e. gasoline-powered vehicles) get better fuel economy on the highway than they do in city driving. But the Automotive Research Center wanted to test if and how driving speed affects fuel economy.

All vehicles tested showed decreases in fuel economy as vehicle speed increased, though some vehicles showed more significant decreases. Conversely, all vehicles experienced increased fuel economy, on average almost 3 miles per gallon and 9%, just by dropping from 65 mph to 60 mph.

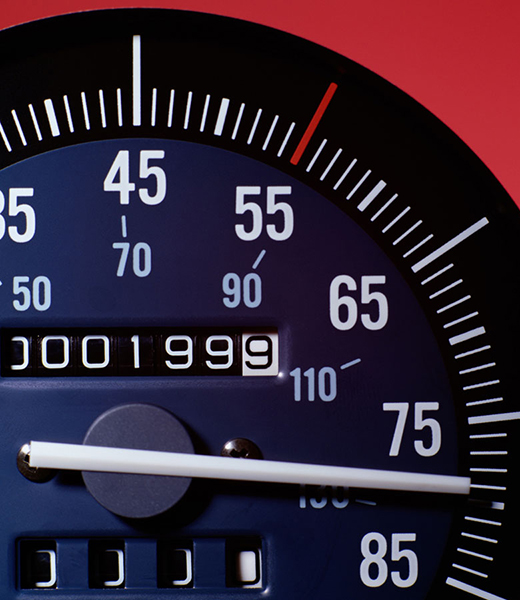
Odometer

How the EPA tests fuel economy

The EPA tests used to determine the fuel economy ratings for passenger cars and light trucks consisted of 5 drive cycles:

  • City
  • Highway
  • Aggressive high speed
  • Hot temperature with air conditioning on
  • Cold temperature

Prior to 2008, only city and highway drive cycles were used. For this test, 3 cycles were added to account for the higher diving speeds and acceleration rates, as well as temperature effects seen in the real world.

The highway fuel economy rating given for vehicles is calculated based primarily on the highway portion of the aggressive high-speed cycle and the older highway cycle. For the individual highway drive cycle used for testing, the top speed was 60 mph—lower than the typical 65 mph speed limit on many U.S. highways and freeways.

While vehicles can achieve better fuel economy at steady highway speeds instead of stop-and-go traffic, that economy begins to drop with increased speed. This is partly due to the aerodynamic drag the vehicle experiences.

The ARC created a test cycle to be used in the lab on the dyno. Test vehicles were driven at 60–85 mph steady state speeds, in 5 mph increments. 

Vehicles tested

Test vehicles were chosen to represent a variety of body styles and powertrain types. The following 11 vehicles were chosen.

Vehicle

Type

Engine

Transmission

2017 Toyota Prius Liftback sedan 1.8L Hybrid
2016 Nissan Versa Note Hatchback 1.6L CVT
2017 Ford Fusion Hybrid Sedan 2.0L Hybrid
2016 Audi A3 Sedan 1.8L Turbo 6DCT
2018 Hyundai Santa Fe Sport CUV 2.4L 6AT
2017 Nissan Quest Minivan 3.5L CVT
2017 Dodge Durango GT AWD SUV 3.6L 8AT
2017 Ford Mustang GT Muscle car 5.0L 6AT
2016 Cadillac Escalade Large SUV 6.2L 8AT
2015 Toyota Tacoma Mid-size pickup 4.0L 5AT
2017 Ford F150 Full-size pickup 3.5L Turbo 10AT

Methodology

A chassis dynamometer was used to evaluate each vehicle’s fuel economy. The vehicles were warmed up to operating temperature, then driven at steady state speed for a total of 4 minutes per test point (1 minute for stabilization, 3 minutes of measuring). They started at 60 mph and increased by 5 mph increments up to 85 mph. The minimum 60 mph was chosen since the EPA highway drive cycle has a maximum speed of 60 mph.

Fuel economy was measured at steady state speeds (constant, stabilized speed with no acceleration nor deceleration), using the vehicle’s cruise control. This was done to eliminate the human influence on the test results and clearly focus on the effects of speed on fuel economy. It also emulates a possible real-world road trip, where the cruise control would typically be used and the vehicle speed may not need to change much from the set point for long amounts of time.

A closer look at the data

All vehicles tested experienced fuel economy losses as speeds increased. A typical highway speed of 65 mph was the baseline for calculating the change in fuel economy. With each 5 mph increase, fuel economy decreased.

Losses ranged from as little as 1.8 mpg at 70 mph to more than 16 mpg at 85 mph, with percentage losses from 6.5% to 37%. Conversely, slowing from 65 mph to 60 mph resulted in fuel economy gains from 1.6 mpg to 3.7 mpg, with percentage increases ranging from 6.1% to 12%.

Fuel economy (mpg)

Vehicle

60 mph

65 mph

70 mph

75 mph

80 mph

85 mph

Toyota Prius 58.1 54.8 47.5 45.8 41.9 38.4
Nissan Versa Note 50.7 47.0 42.8 39.2 35.7 32.0
Ford Fusion Hybrid 44.9 41.4 37.3 35.3 31.7 30.4
Audi A3 41.3 38.3 35.8 33.3 30.6 28.6
Hyundai Santa Fe Sport 35.3 32.4 30.2 27.2 24.9 23.0
Nissan Quest 35.0 31.9 29.2 26.6 24.0 22.0
Dodge Durango 33.3 30.5 27.9 25.8 23.9 21.8
Ford Mustang GT 28.4 26.8 25.0 23.4 22.0 20.5
Cadillac Escalade 29.5 26.3 23.2 21.5 19.9 18.4
Toyota Tacoma 24.8 22.9 20.8 19.0 17.6 16.4
Ford F150 24.0 21.7 19.4 17.4 15.4 13.7

Average

36.6

33.8

30.7

28.5

26.1

24.1


Mpg difference from 65 mph

Vehicle

60 mph

65 mph

70 mph

75 mph

80 mph

85 mph

Toyota Prius 3.3 0.0 -7.3 -9.0 -12.8 -16.4
Nissan Versa Note 3.7 0.0 -4.2 -7.8 -11.2 -15.0
Ford Fusion Hybrid 3.5 0.0 -4.0 -6.0 -9.6 -10.9
Audi A3 3.0 0.0 -2.5 -5.0 -7.7 -9.7
Hyundai Santa Fe Sport 2.8 0.0 -2.2 -5.2 -7.5 -9.5
Nissan Quest 3.1 0.0 -2.7 -5.3 -7.7 -9.9
Dodge Durango 2.7 0.0 -2.6 -4.7 -6.6 -8.7
Ford Mustang GT 1.6 0.0 -1.8 -3.4 -4.8 -6.4
Cadillac Escalade 3.2 0.0 -3.1 -4.8 -6.4 -8.0
Toyota Tacoma 1.9 0.0 -2.1 -3.9 -5.3 -6.5
Ford F150 2.3 0.0 -2.3 -4.3 -6.3 -8.0

Average

2.8

0.0

-3.1

-5.3

-7.7

-9.8


Percent mpg difference from 65 mph

Vehicle

60 mph

65 mph

70 mph

75 mph

80 mph

85 mph

Toyota Prius 6.1% 0.0% -13.3% -16.4% -23.4% -29.9%
Nissan Versa Note 7.9% 0.0% -8.8% -16.6% -23.9% -31.9%
Ford Fusion Hybrid 8.6% 0.0% -9.7% -14.6% -23.3% -26.4%
Audi A3 7.9% 0.0% -6.5% -13.0% -20.1% -25.2%
Hyundai Santa Fe Sport 8.8 0.0% -6.8% -16.1% -23.1% -29.2%
Nissan Quest 9.9% 0.0% -8.4% -16.7% -24.1% -30.9%
Dodge Durango 9.0% 0.0% -8.7% -15.3% -21.6% -28.4%
Ford Mustang GT 6.1% 0.0% -6.9% -12.6% -18.0% -23.7%
Cadillac Escalade 12.0% 0.0% -11.7% -18.1% -24.5% -30.2%
Toyota Tacoma 8.2% 0.0% -9.2% -17.2% -23.2% -28.5%
Ford F150 10.7% 0.0% -10.7% -19.6% -28.9% -36.8%

Average

8.5%

0.0%

-9.0%

-15.9%

-22.8%

-28.9%


What’s the bottom line?

These tests showed that across the board, fuel economy decreases as vehicle speed increases, though the specifics vary by vehicle.

Of the vehicles tested, those with better overall fuel economy experienced the greatest mpg decreases at faster speeds. The Toyota Prius, for example, achieves about 55 mpg at 65 mph and lost as many as 16.4 mpg at 85 mph.

Additionally, by decreasing speed from 65 mph to 60 mph, the vehicles experienced increased fuel economy of an average 3 miles per gallon.

back to top icon